CD.8 |
SUCROSE HYDROLASE |
|
|
|
Function |
EC*1 |
CSA distance*2 |
3.2.1.48 |
2.1 |
|
*1 Enzyme commission number. |
Ligand |
PDB*1 |
Full name |
SUC |
SUCROSE |
|
*1 Ligand name designated by the PDB identifiers. |
Segments |
Component No. |
Fixed*1 |
Moving*1 |
Motion type |
Ligand binding |
Coupled motion type |
1 |
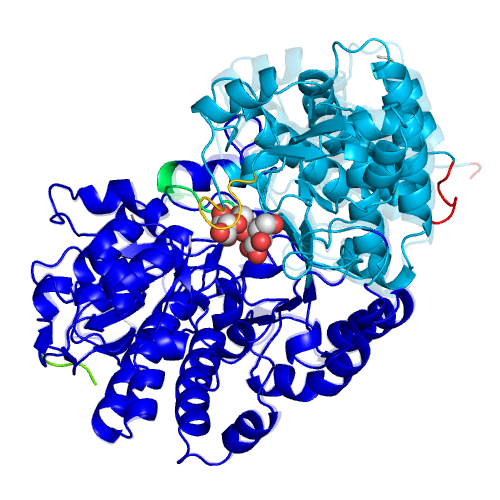
D1(81A-128A,145A-146A,149A-172A,320A-321A,323A-332A,334A-342A,346A-435A,442A-607A,624A-635A) |
D2(8A-19A,24A-80A,129A-144A,147A-148A,173A-221A,228A-319A,333A-333A,343A-345A) |
Domain |
Coupled |
Closure |
2 |
D1 |
L3(608A-608A,620A-623A) |
Local |
Independent |
|
3 |
D2 |
L4(222A-228A) |
Local |
Coupled |
Closure |
4 |
D2 |
L5(18A-23A) |
Local |
Independent |
|
*1 The location of the fixed and moving segments indicated by the residue number assigned in the ligand-bound form. The background color of characters indicates the corresponding segment in the structure. The colored segments not described in the Table are: 1) a part of component in which the motion is small (< 1.0 A), or, 2) a part of a protomer of homodimers, for which a corresponding part of the other protomer is shown in the Table. |
Displacement and disorder |
Component No. |
RMSD*1 |
Displacement*2 |
Disorder-order transition*3 |
Disorder residue*4 |
Helix-Coil*5 |
1 |
1.2 |
||||
2 |
Yes |
+5 |
|||
3 |
Yes |
+6 |
|||
4 |
Yes |
+4 |
|
*1 The root-mean-square displacement of a component of motion calculated for the domain motions. |
Linear response |
Component No. |
Correlation coefficient*1 |
1 |
0.93 |
2 |
|
3 |
|
4 |
|
*1 The correlation coefficient between the displacement vector predicted by the linear response theory and the one observed in the crystal structures. |

