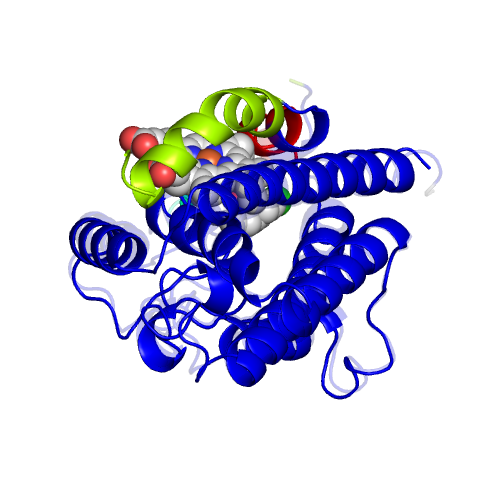
CL.19 |
HEME OXYGENASE 1 |
|
|
|
Function |
EC*1 |
CSA distance*2 |
1.14.99.3 |
0.6 |
|
*1 Enzyme commission number. |
Ligand |
PDB*1 |
Full name |
224,HEM |
2-[2-(4-CHLOROPHENYL)ETHYL]-2-[(1H-IMIDAZOL-1-YL)METHY]-1,3-DIOXOLANE,HEME |
|
*1 Ligand name designated by the PDB identifiers. |
Segments |
Component No. |
Fixed*1 |
Moving*1 |
Motion type |
Ligand binding |
Coupled motion type |
1 |
D1(31A-34A,42A-223A) |
L2(10A-30A) |
Local |
Coupled |
Closure |
2 |
D1 |
L3(35A-41A) |
Local |
Coupled |
Opening |
|
*1 The location of the fixed and moving segments indicated by the residue number assigned in the ligand-bound form. The background color of characters indicates the corresponding segment in the structure. The colored segments not described in the Table are: 1) a part of component in which the motion is small (< 1.0 A), or, 2) a part of a protomer of homodimers, for which a corresponding part of the other protomer is shown in the Table. |
Displacement and disorder |
Component No. |
RMSD*1 |
Displacement*2 |
Disorder-order transition*3 |
Disorder residue*4 |
Helix-Coil*5 |
1 |
Yes |
+20 |
|||
2 |
4.4 |
|
*1 The root-mean-square displacement of a component of motion calculated for the domain motions. |
Linear response |
Component No. |
Correlation coefficient*1 |
1 |
|
2 |
0.48 |
|
*1 The correlation coefficient between the displacement vector predicted by the linear response theory and the one observed in the crystal structures. |

