Help document for IDEAL
IDEAL, Intrinsically Disordered proteins with Extensive Annotations and Literature (https://www.ideal-db.org/), is a collection of knowledge on experimentally verified intrinsically disordered proteins (IDPs). IDEAL contains manual annotations by curators on intrinsically disordered regions (IDRs), interaction regions with other molecules, post-translational modification sites, references, structural domain assignments, and diagrams illustrating biological processes. We particularly focus on collecting interaction regions that undergo a disorder-order transition upon intermolecular or intramolecular interactions. In IDEAL these regions are called Protean segments (ProS's).
IDEAL development team
Satoshi Fukuchi, Ph. D. Maebashi Institute of Technology
Motonori Ota, Ph. D. Nagoya University

Last revised in July 2024
How to use IDEAL
Top page
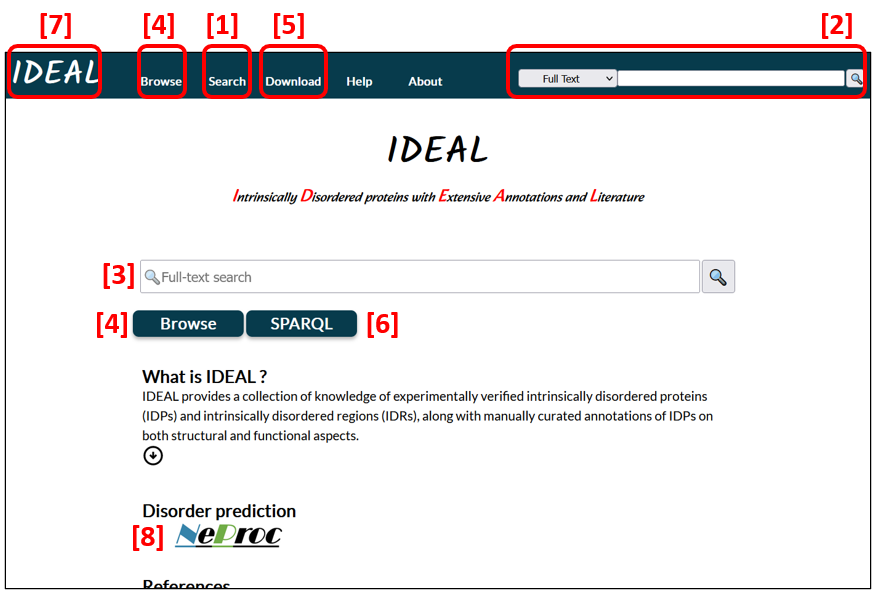
The search tools [1, 2, 3 in Fig. 1] accept full text, a protein name, an IDEAL ID, a UniProt entry accession, and a PDB ID. In addition, Search [1] provides a Blast search to compare an amino acid sequence to the entries in IDEAL to find sequences in IDEAL that resemble the query sequence.
Users can browse through the entry list or the biological process list [4]. For details, see the entry list and the biological process list.
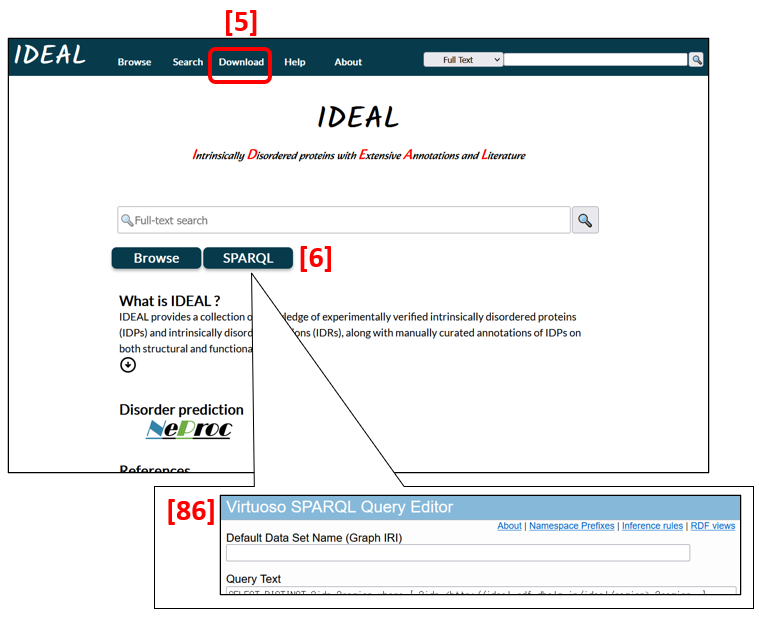
All data are downloadable in XML and RDF formats [5]. A SPARQL search can be conducted from SPARQL [6] and Search [1]. To return to the first page (Fig.1), click IDEAL in the top navigation bar [7]. The bar is stationary on the screen while users move up and down or jump to another page.
NeProc (Next ProS classifier) [8] predicts IDRs and ProS regions.
Entry, edge, network and diagram
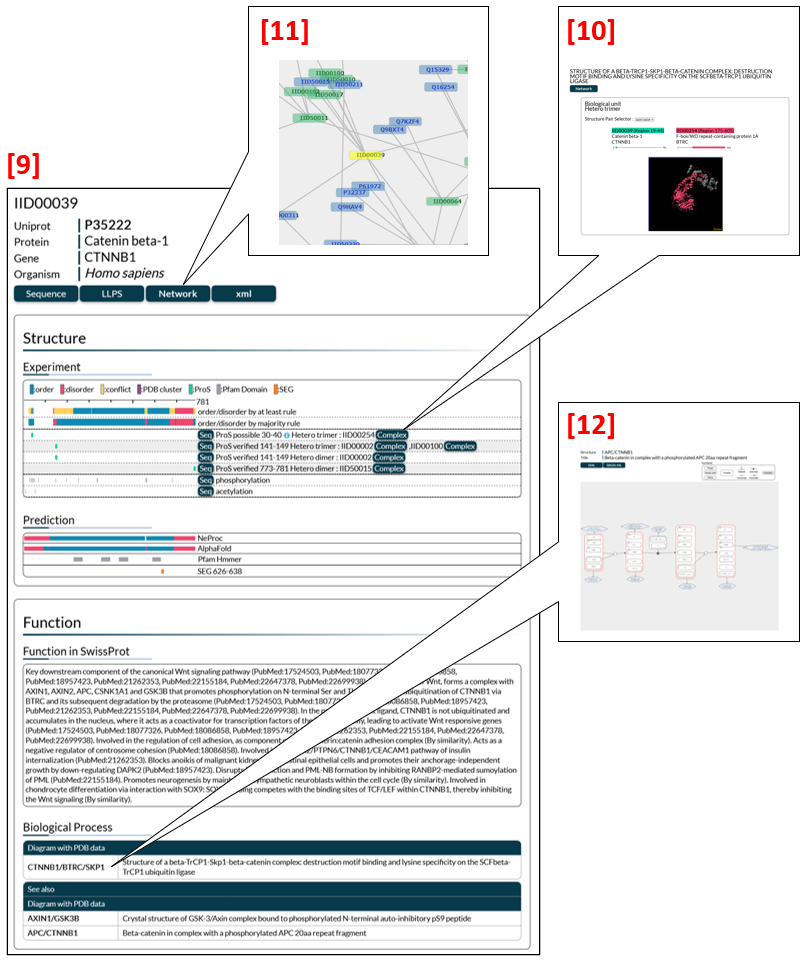
IDEAL has four types of pages (Fig. 2) to show annotations on IDPs. From an entry page [9] users can move to an edge, a network and a diagram page to get different types of information about protein-protein interactions (PPIs) and biological processes. The edge page [10] focuses on an interaction of the entry with its binding partner protein, while the network page [11] illustrates a large-scale PPI network. In the diagram page [12], biological processes in which the entry is involved are presented schematically with annotations.
Entry list
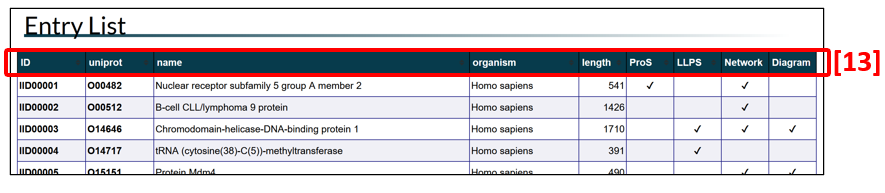
Protein entries are listed in ascending order according to IDEAL-ID (IID) by default. The order of the entries can be changed by clicking the title of each column in the table header [13 in Fig. 3]. IID starts from IID00001 for human proteins, IID50001 for other eukaryotic proteins, and IID90001 for proteins of non-eukaryotic organisms, including viruses. Each UniProt entry accession is linked to the corresponding UniProt entry. The columns for ProS, LLPS (liquid-liquid phase separation), Network and Diagram indicate the presence/absence of the relevant information in the respective categories. To see the entry page of a protein of interest, click the IID.
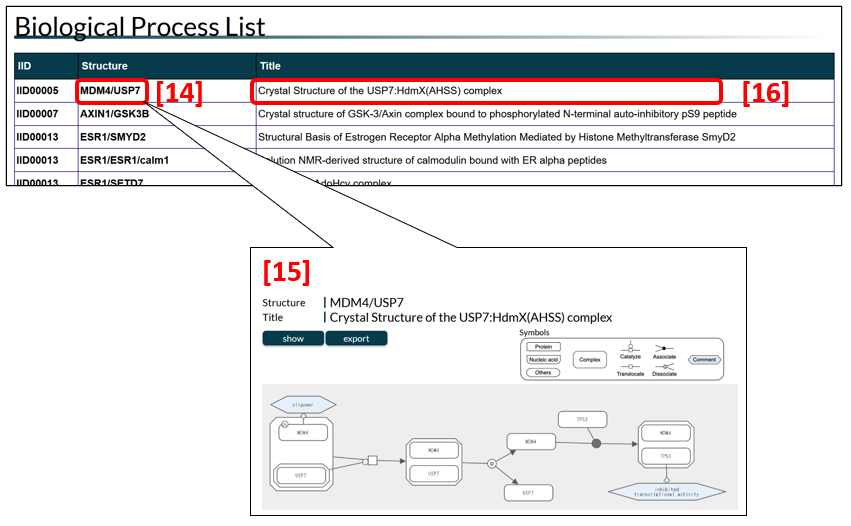
Biological process list
IDEAL provides schematic diagrams of biological processes in which IDPs are involved. The biological process list tabulates IDEAL entries that have diagrams (Fig. 4). To see a diagram [15], click a name in the structure column [14]. A name in this column represents the name of a representative complex in the diagram, and the title column shows the PDB title of the complex [16]. A complex name is comprised of protein names of the complex members separated by “/”; the first one is that of the protein in the IID column, while the second one is that of the binding partner. In some cases, a complex is a part of a larger protein structure complex; for instance, the AXIN1/GSK3B complex (PDB-ID: 4nm3) is a portion of the AXIN1/APC/CTNNB1/GSK3B/CSNK1A1 complex. The IDEAL IDs in the IID column are linked to the IDEAL entries.
Entry page
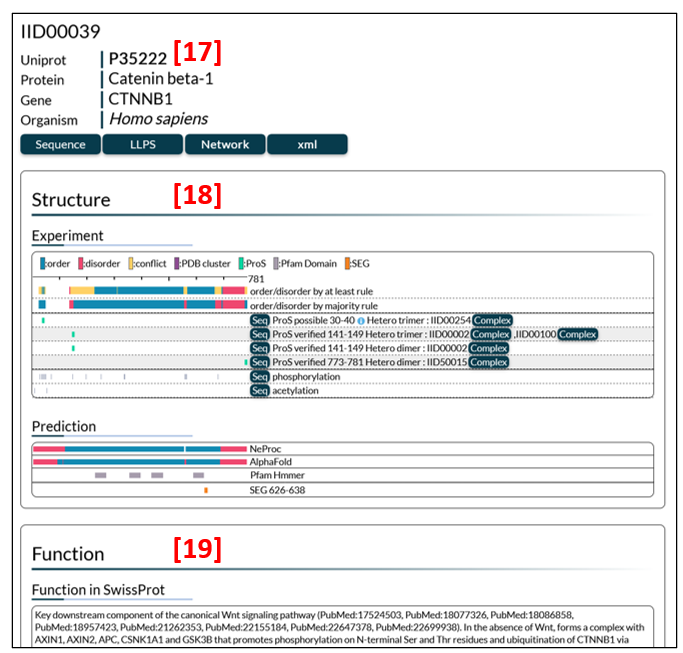
The entry page (Fig. 5) is a summary of annotations on each entry (protein) in IDEAL. The entry page consists of general information [17], structure [18] and function [19].
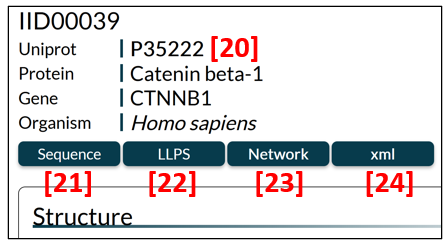
General information
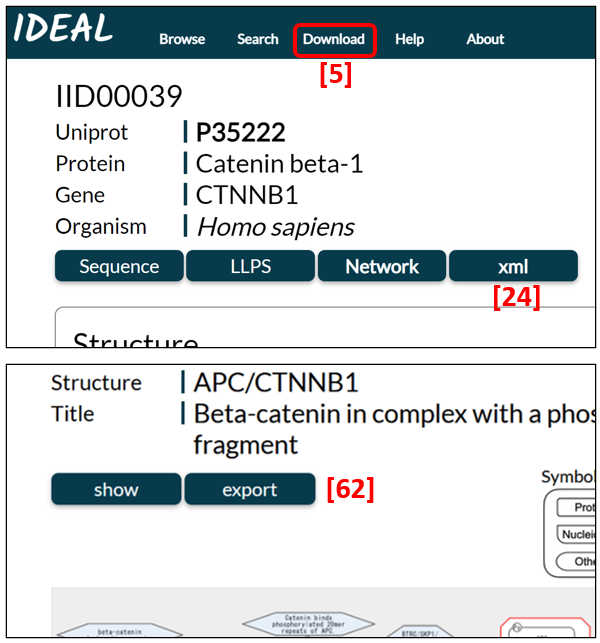
The general information section (Fig. 6) contains an IDEAL identifier (IID), a UniProt entry accession linked to UniProt [20], a protein name, a gene name and an organism name. The user can click the Sequence button [21] to display the amino acid sequence, the LLPS button [22] to find link options to the LLPS databases (PhaSepDB, PhaSePro, LLPSDB, DrLLPS), the Network button [23] to move to a PPI network page, and the xml button [24] to download the data of the entry in XML format.
Structure
Structural annotations are schematically divided into the experimental section and the prediction section.
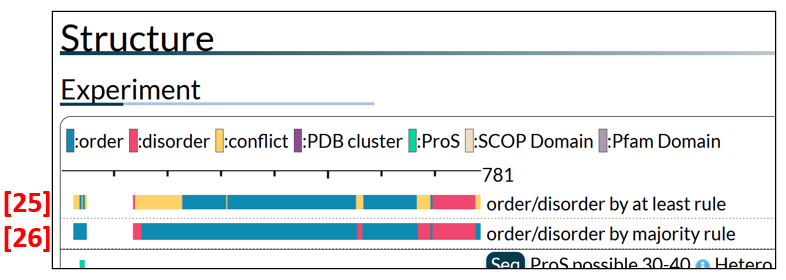
Experiment
Experimentally determined data for protein structure are either obtained from the PDB or extracted manually from literature.
Since there are multiple experimental data for a region in most cases, order/disorder states are summarized by applying either the “at least” rule [25 in Fig. 7] or the majority rule [26]. The “at least” rule annotates a region as order (disorder) if the region has at least one piece of experimental evidence for order (disorder), while it annotates a region as conflict if experimental evidence on the order/disorder state of the region is contradictory. Clicking a bar by the “at least” rule gives details [27 in Fig. 8]. The majority rule assigns order/disorder by the majority of the order/disorder states. Click the summary bar by the majority rule to see the PDB and manually annotated datasets [28]. Some PDB datasets are clustered on the basis of sequence or structural similarity (see PMID: 24178034 for details of the clustering method used). The clustered datasets are shown collectively as a magenta bar. Click it to see the individual datasets with annotations, as in [29].
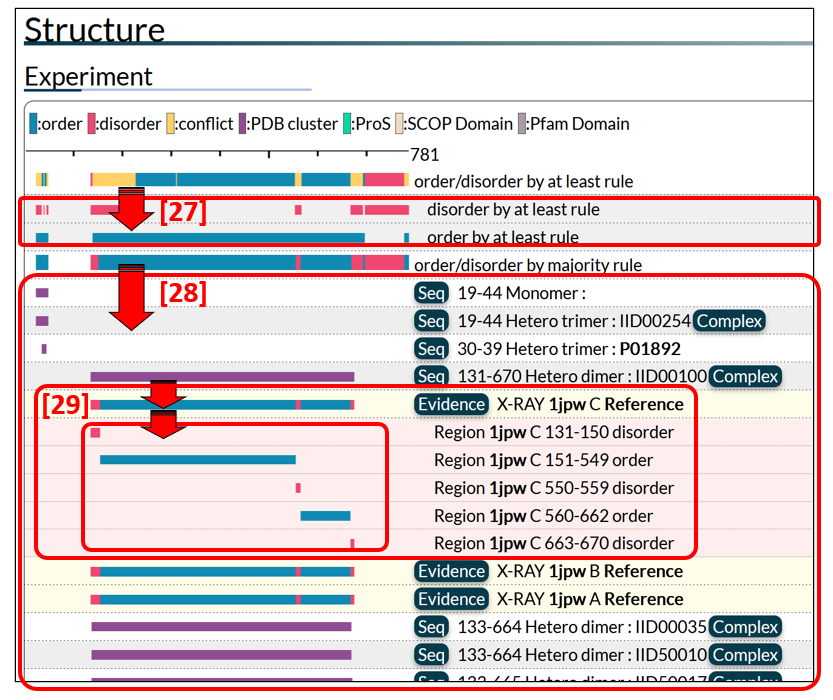
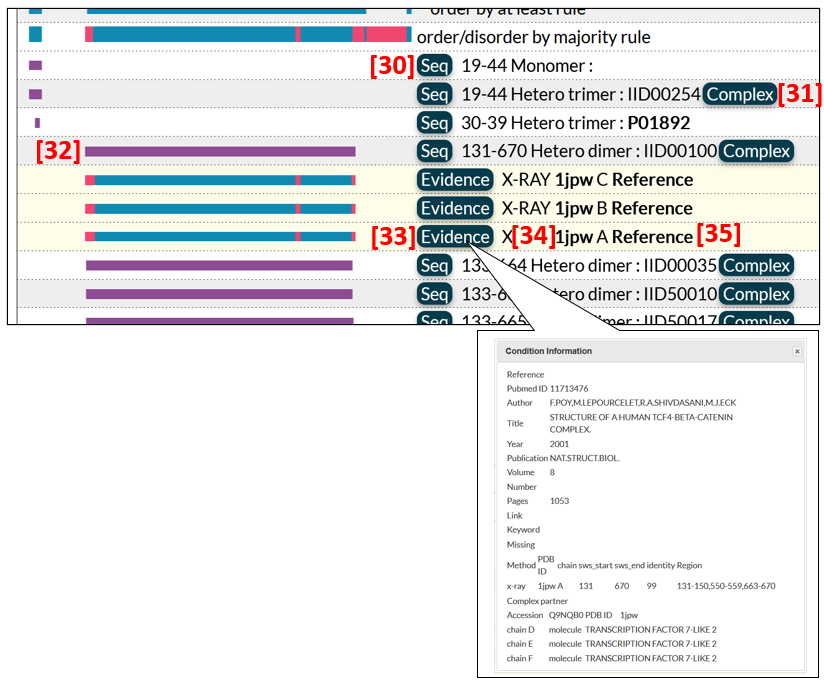
A click on the Seq button [30 in Fig. 9] prompts an exhibit of the amino acid sequence with the region corresponding to the magenta bar highlighted in colour. The start and end residue numbers of the region and the oligomeric state of the PDB structure are also presented. If binding partners exist, the IID or UniProt entry accessions are listed. The Complex button [31] provides a link to the edge page of the protein complex. Clicking the magenta bar, detailed annotations on the cluster will appear [32]. Red and blue rectangles represent disordered and ordered regions, respectively. A click on the Evidence button [33] displays the experimental data for the annotation, that is, experimental methods, PDB identifiers with chain IDs [34], and references with links to PubMed [35].
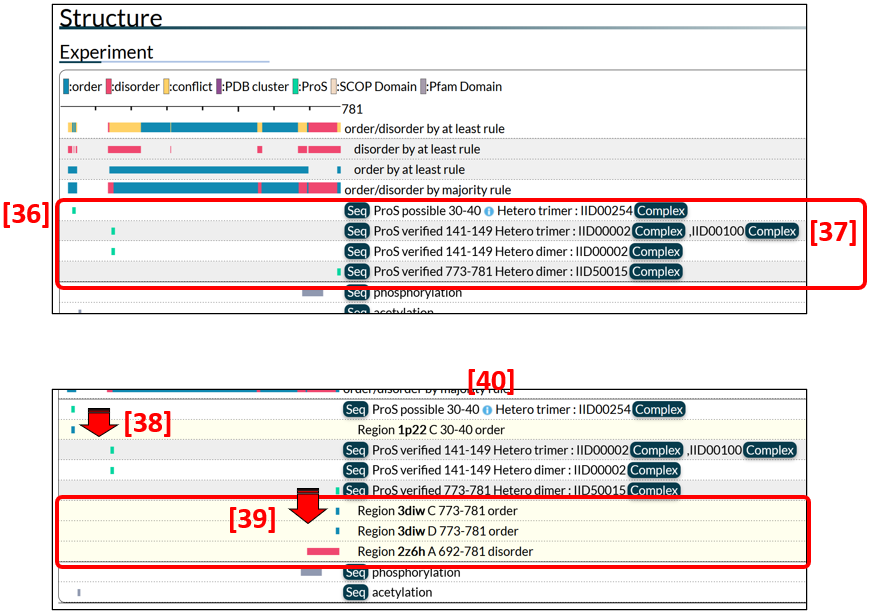
The summary of annotated datasets for ProS is shown in Fig. 10 [36], in which green bars correspond to ProS regions. A link to the edge page is available from the Complex button [37] if the binding partner protein has an IID.
To express different degrees of authenticity of ProS regions, we define three types of ProS: verified, possible, and predicted ProS's. If experimental evidence is available for ordered and disordered states in a given region, the region is regarded as a verified ProS. A region is designated as a possible ProS if it only has evidence for an ordered (or disordered) state in a binding state but is considered to be a ProS based on circumstantial evidence. For example, the KIX domain of human CREB1 (IID00442) is defined as a possible ProS because the corresponding region of the rat ortholog (IID50004) was experimentally shown to be disordered in an isolated state. Another example of a possible ProS is the region containing a nuclear localization signal (NLS) of Ncbp1 (IID50179). An NLS motif belongs to short linear motifs (SLiMs), which are generally located in IDR and acquire a secondary structure upon binding to a structured partner. A region is defined as a predicted ProS if the region has experimental evidence for an ordered state and the evidence for a disordered state is based solely on structure predictions by tools such as AlphaFold and NeProc.
Clicking the green bar of a ProS region, the user can obtain further information on experimental evidence for order/disorder states such as PDB datasets [38, 39]. Some PDB datasets are clustered as shown [39]. Datasets for possible or predicted ProS's have only ordered region(s) [38]. To see comments for the ProS, click  [40]. PDB entries of some proteins are numerous due to intensive studies for ligand/drug screening. In such a case, representative PDB entries are presented as ProS evidence.
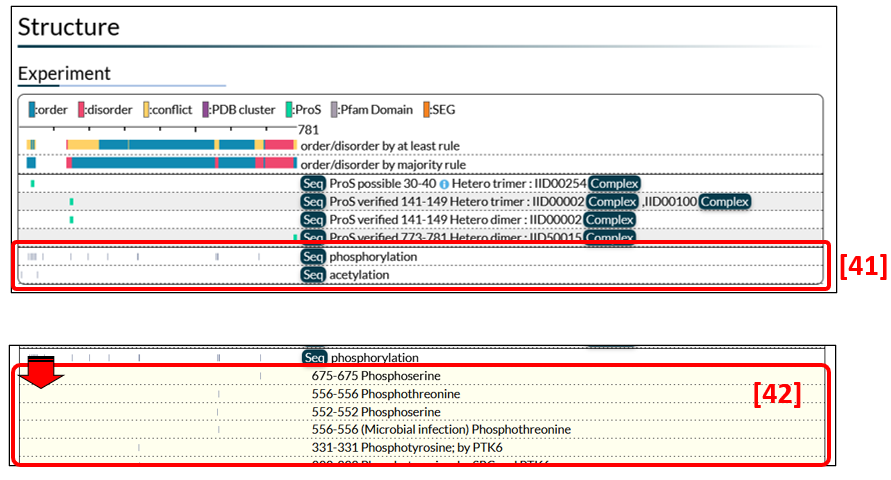
Information on post-translational modification (PTM) sites in Fig. 11 [41] was extracted from UniProt. Further details become visible by clicking grey bars on the left side [42].
Prediction
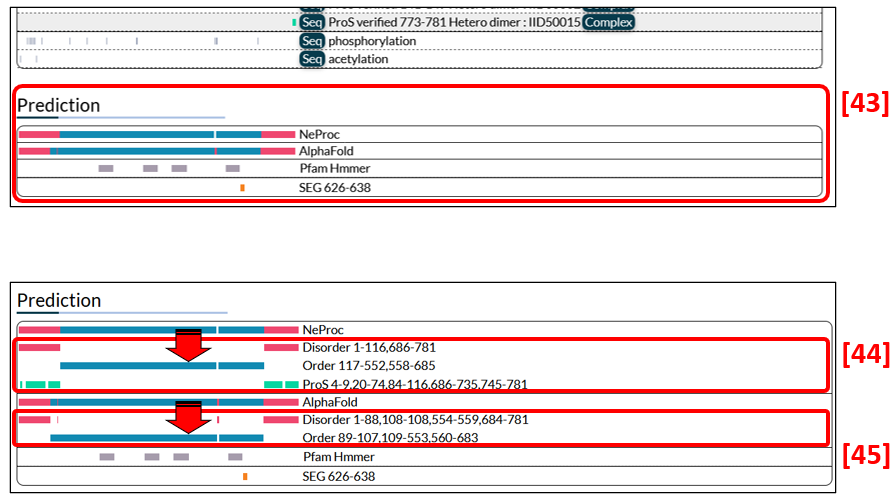
Predictions of disorder/order regions by NeProc and AlphaFold and low complexity regions by SEG are presented in Fig. 12 [43]. Additionally, NeProc predicts ProS regions and are shown [44]. In datasets predicted by AlphaFold, regions with pLDDT<68.5% are defined as disordered. Note that AlphaFold cannot predict the entire region if a protein sequence is longer than 2700 residues. In such cases, no results are shown. Also, IDEAL displays no AlphaFold predictions if they are unavailable. Click a bar presentation to see information on the residue numbers of the predicted regions [44, 45]. The colour codes used here are the same as described above.
Function
Function in SwissProt
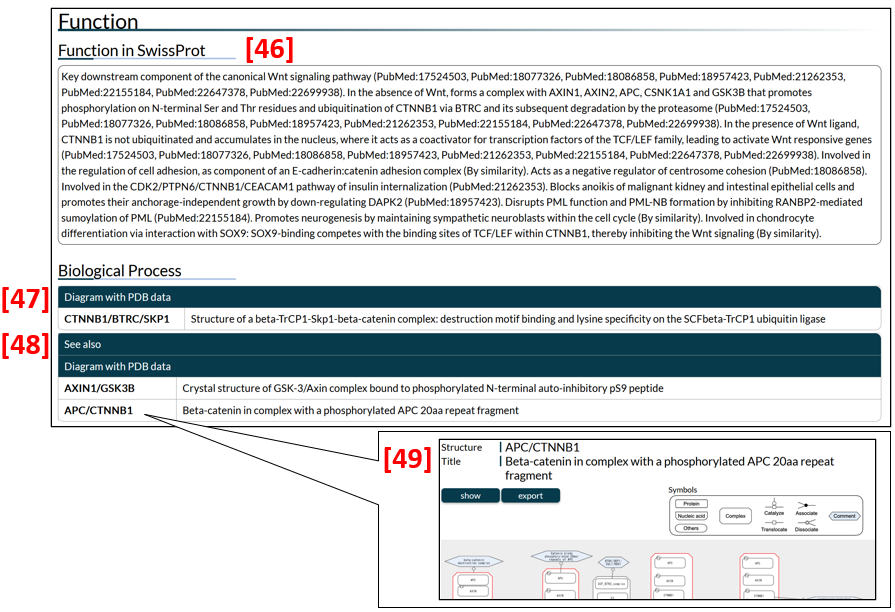
For users' convenience, the function section of SwissProt is included [46]. Note that descriptions of isoforms are not shown in some entries.
Biological Process
The ability of many IDPs to bind to a partner molecule is regulated by PTMs induced by a variety of signalling pathways. Diagrams in IDEAL show biological processes in a sequential transition to depict changes in IDPs and their biological significance, such as newly gained functions and subcellular translocation. Users can access diagrams by clicking the name of a complex (in the structure column) listed in biological process. For example, CTNNB1/BTRC/SKP1 in Fig. 13 [47] is linked to the diagram of Catenin beta-1 (gene name: CTNNB1, IID00039), portraying a process in which the CTNNB1/BTRC/SKP1 complex plays a role. Whenever an entry such as CTNNB1 appears in diagrams of other entries (e.g., APC), the diagrams are mentioned in the "See also" list [48]. In the given example, clicking "APC/CTNNB1" displays a diagram for APC [49]. See the "Diagram page" section for further details in diagrams.
Edge page
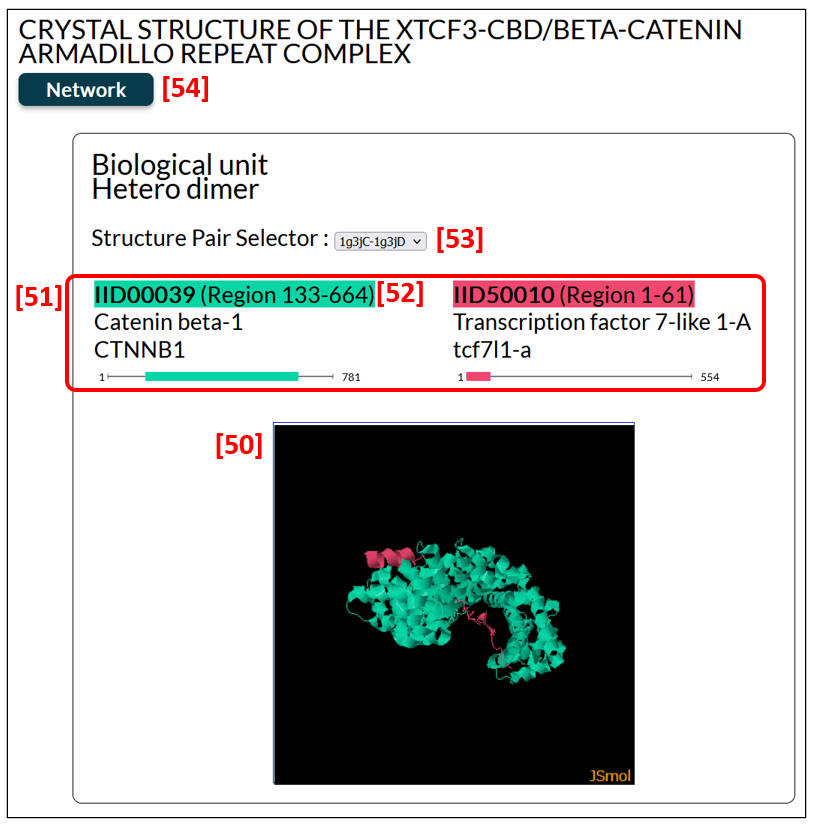
The edge page provides a 3D structural view of the complex of an IDEAL entry with its binding partner, displayed by the J-mol applet [50]. Fig. 14 is the edge page of a complex of catenine beta-1 and transcription factor 7-like 1-A (PDB ID: 1g3j). Using a mouse, users can rotate and zoom in and out the structure. The corresponding region and the colour of each molecule are shown [51]. PDB structures are clustered as explained in the experiment section, and the structure pair selector [53] enables users to choose a protein complex to display. The IID [52] provides a link to each entry page. To see the PPI network in which this complex is involved, click Network [54].
Network page
The network page displays a large-scale PPI network. The node for the protein of interest (the entry protein) is coloured yellow in Fig. 15 [55], while nodes in green indicate proteins containing ProS's. Upon pointing at a node (IID or UniProt ID), the protein name of the node appears [56], while clicking it opens the entry page in IDEAL or UniProt of the protein [58]. By pointing at a line connecting two nodes, a PDB ID with chain IDs appears [57] and by clicking a line, the edge page opens [59].
A network map can be zoomed in or out by using a mouse or two-finger scroll.
Users can get the network by dragging the mouse and modify its shape as they wish.
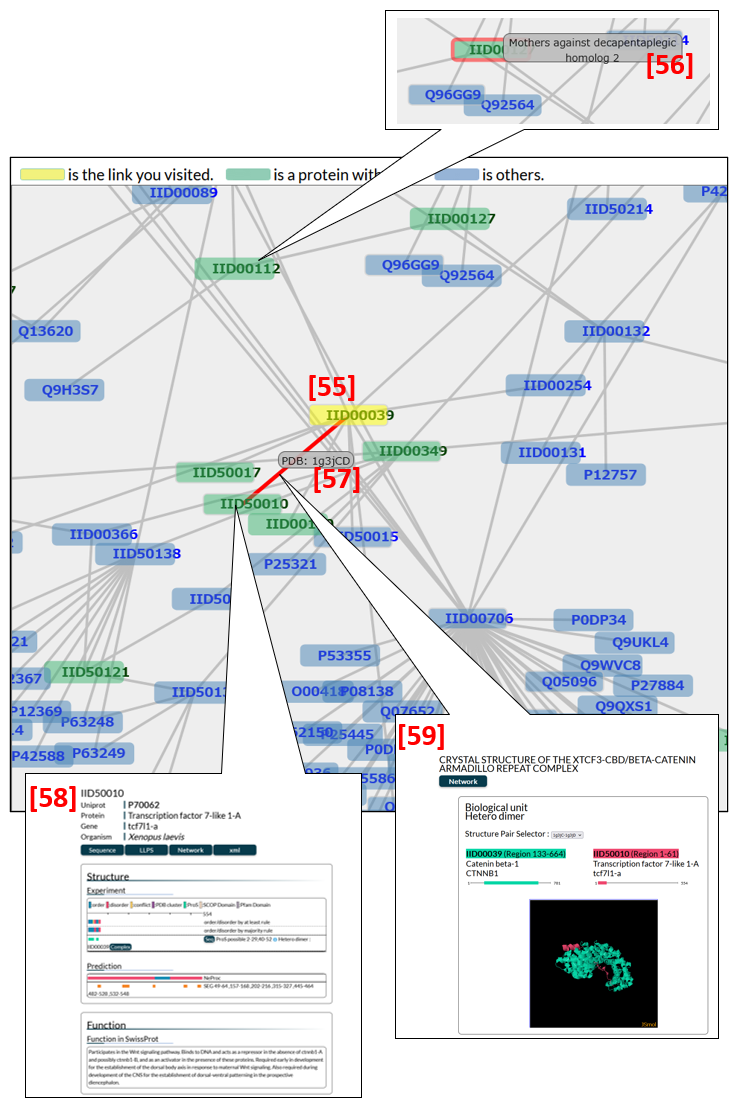
Diagram page
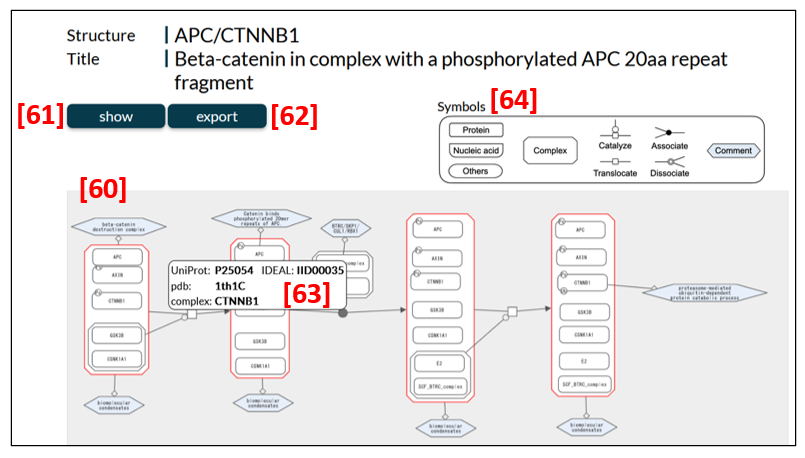
A diagram in Fig. 16 [60] illustrates state transitions of IDPs in biological processes induced by triggers, such as post-translational modifications (PTMs). The diagram is interactive and can be modified in ways users would like; for instance, it can be zoomed in and out and the node positions can be rearranged. The data of each diagram can be seen in XML, SBGN-ML and RDF formats from the show button [61]. Data in XML, SBGN-ML and RDF formats and the PNG file of a diagram are downloadable from the export button [62]. A dataset in SBGN-ML format allows users to reproduce a diagram by using graphic software, such as ChiSE, in their own computers.
When a node is pointed at and right-clicked, a pop-up [63] appears and shows the UniProt entry accession, an IDEAL ID and binding partner(s) of the node protein, and the PDB ID of the complex (or protein) of interest. Through these pieces of information in a pop-up, users can access the entry page in IDEAL and UniProt, the edge page and the PDBj site of the complex.
Symbols used in diagram
The symbols used in diagrams are shown at the top-right corner of the diagram page [64].
Nodes
The four types of nodes represent protein, nucleic acid, complex and other molecules. The node for a complex, which forms droplets by liquid-liquid phase separation (LLPS), has a red frame.
Process nodes and connecting arcs
Nodes are connected by process nodes and connecting arcs to illustrate mainly four types of transitions: catalyze, associate, dissociate, and translocation.
Comments
Some pieces of information (e.g., subcellular location, the function of a complex and phenotype relating to molecular functions) can deepen the understanding of biological processes but cannot easily be integrated directly into the diagram format.
Such information is given as comments in blue hexagons.
PTM
Post-translational modifications, such as phosphorylation and ubiquitination, are indicated as circled symbols attached to nodes.
The PTM symbols used are:
P; Phosphorylation, Ps; Phosphorylation on multiple residues, mUb; Monoubiquitination, mUbs; Monoubiquitination on multiple residues, Ub; Polyubiquitination, Ubs; Polyubiquitination on multiple residues, Me; Methylation, me1; Monomethylation, me1s; Monomethylation on multiple residues, me2; Dimethylation, me3; Trimethylation, OH; Hydroxylation
How to interpret a diagram
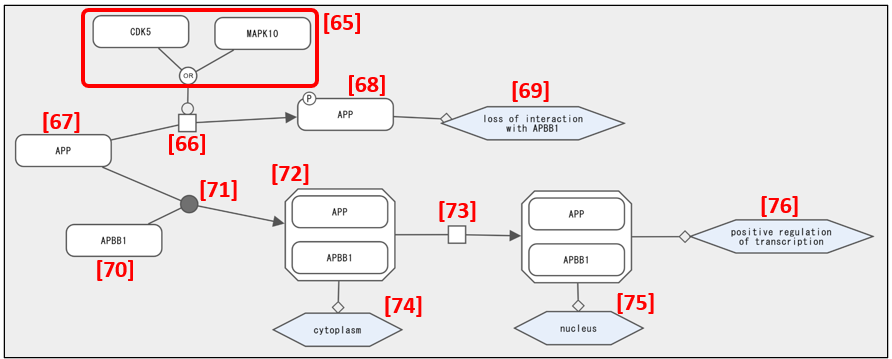
CDK5 or MAPK10 in Fig. 17 [65] phosphorylates [66] APP [67] and the phosphorylated APP [68] loses its ability to bind APBB1 [69]. After binding [71] of APP [67] and APBB1 [70] to form the APP/APBB1 complex [72], the complex translocates [73] from the cytoplasm [74] to the nucleus [75] and regulates transcription positively [76].
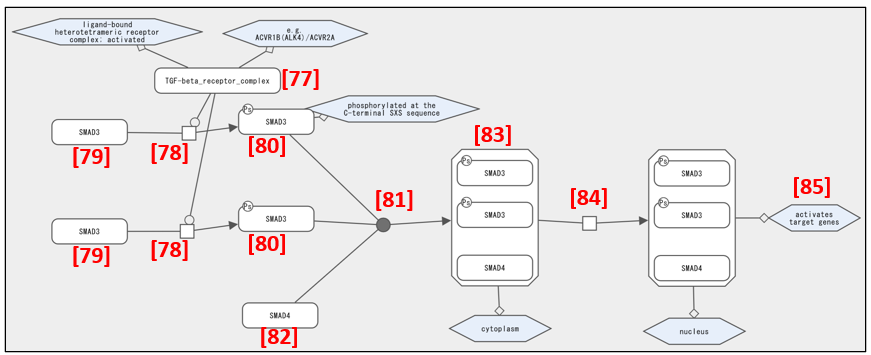
The TGFβ receptor complex in Fig. 18 [77] phosphorylates [78] SMAD3 [79]. Two molecules of phosphorylated SMAD3 [80] bind [81] to SMAD4 [82] and form a SMAD3/SMAD3/SMAD4 hetero-trimer [83]. The trimer translocates [84] to the nucleus and activates target genes [85].
Downloadable data
XML files
The file for the entire datasets of IDEAL in XML format is downloadable from Download in Fig. 19 [5]. To download XML files for individual entries and diagrams, click xml [24] and export [62], respectively.
For diagrams, the data are available in SBGN-ML format that enables users to feed the diagram data to graphic software to reproduce and arrange them in their own computers.
Revisions in the XML scheme
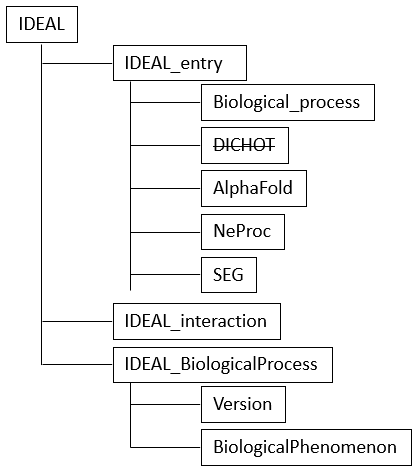
In the course of renewing IDEAL in 2024, several changes were made to the XML scheme. Among them, the main changes are the inclusion of IDEAL_BiologicalProcess and the replacement of DICHOT by AlphaFold and NeProc for IDR prediction (Fig. 20).
To download the current XML chart, click XML chart under Help, or visit https://www.ideal-db.org/help_main.html.
RDF files
The file for the entire datasets of IDEAL in RDF format is downloadable from Download in Fig. 21 [5]. To obtain RDF files for individual diagrams, click the export button (Fig. 19) [62].
The SPARQL button in Fig. 21[6] on the top page leads to the Virtuoso SPARQL Query Editor in the DBCLS server [86] and enables users to submit a query.